
My SIT314 project was the cloud backend for a fleet of simulated driverless taxis. A rider asks for a car and a dispatch service picks one. For the High Distinction task I had to find the state of the art on one part of my own system, apply it, and measure what changed. I wrote it for SIT314 Software Architecture and Scalability for the Internet of Things at Deakin, in Trimester 2 2026. This post is that paper, cut down. The walkthrough comes first, then the numbers, then what I would not claim from them.
The system it applies to
The project also moved its queue, dispatch worker and state service to AWS, but every measurement in this post ran on one laptop. 2,000 simulated taxis publish telemetry over MQTT. A Node-RED flow filters the stream, a state service keeps live per-car state and answers "which free cars are near this point", and ride requests go on a queue. Dispatch workers pull requests off the queue, ask for candidates and claim a car. An autoscaler adds workers when the backlog grows. The service area is a box about 20 km by 16 km centred on the Melbourne CBD, split into nine zones.
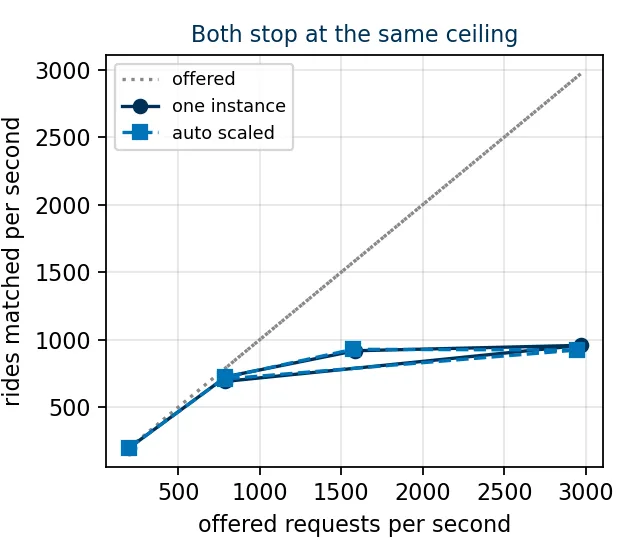
The load harness ramps requests through five stages: 200, 800, 1,600 and 3,000 a second, then back to 800. A matched car is held for 300 ms to stand in for a trip. In the project report the platform topped out near 950 matches a second at the peak stage, with about 61,000 requests left without a car, while match latency stayed flat. I read the limit as the number of free cars, though my instrumentation could not cleanly separate an empty candidate list from cars claimed first by someone else.
The decision I went looking for
The dispatch worker pulls up to eight requests off the queue at once. Then it throws that grouping away. Each request races for its own nearest free car, with no reference to the other seven in its hand.
DiDi Chuxing describe a close relative of this arrangement as the thing they replaced: each order matched on its own to its best-scoring driver. Zhang et al. (2017) call it Model 1 and say it "was used at Didi Chuxing until the method of this paper was proposed". Their replacement optimises over a whole batch. They ran it live for a day on Beijing traffic against two models used in industry, one of them DiDi's own previous dispatcher, splitting drivers and orders into three flows by phone number. Global success rate went from 79.8% on the old model to 84.4% on theirs.
Eom and Toriello (2026) give the theory for when this should help and when it should not. They compare matching straight away with holding requests and solving over the pool. On a Manhattan ride-sharing instance they report that "the modified greedy and batching policies are both already within 91% of optimal for a sojourn period of 6", reaching 95% or better at 18, while plain greedy "achieves less than 70% in all cases". The cost is that under batching "agents wait in the system on average for half of the sojourn period".
One paper says the mechanism works in production. The other says the size of the win depends on how thick the market is. So even a null result would have told me something.
What does not transfer
DiDi's Algorithm 1 is a hill climb. Seed every driver with the order it scores highest on and work out the mean success rate. Then, for each order, walk the drivers not holding it and keep any swap that raises the mean. The objective for order i is:
Here pij is a learned probability that driver j accepts order i, and aij is 1 when order i is sent to driver j. The product is there because an order goes out to several drivers and any one of them may take it. More drivers on an order means a better chance somebody says yes.
I transliterated that first. My system has no acceptance model, so I swapped pij for a score from the pickup distance, 1 / (1 + metres / 500). It came out worse than the greedy matcher it was meant to beat. Over 500 batches of eight requests against 200 free cars it averaged 736 m of pickup distance. Greedy averaged 660 m, so that is 11.5% worse. The adapted version below averaged 657 m.
That is not a bug in their algorithm. A driverless car does not refuse a job. Once the claim succeeds pij is effectively 1, the product collapses to one term, and putting five cars on one request stops being insurance. It becomes four cars sent to the wrong place.
So I kept the search and dropped the broadcast. Each request gets at most one car and each car at most one request. Ei becomes the score of whichever car holds request i.
Two parts of my version are mine rather than theirs. Algorithm 1 seeds by giving every driver its own best order. Mine seeds with the greedy answer and only accepts moves that raise the total score, so it starts from what the project already did. And Algorithm 1 moves one driver at a time, while mine does a two-way swap when the car it wants is already held, which the one-to-one rule makes necessary. Both versions live in lib/assign.js and both were measured.
var moved = true, passes = 0;
while (moved && passes < 4) {               // capped at four passes
    moved = false;
    passes++;
    for (var i3 = 0; i3 < N; i3++) {
        for (var vid in score[i3]) {
            if (holder[i3] === vid) continue;
            var other = owner[vid];
            var before, after;
            if (other === undefined) {
                // free car. only request i3 changes.
                before = val(i3, holder[i3]);
                after = val(i3, vid);
                if (after > before) {
                    if (holder[i3] !== null) delete owner[holder[i3]];
                    holder[i3] = vid; owner[vid] = i3;
                    moved = true;
                }
            } else {
                // held by another request, so this is a swap and both move.
                // my car only goes to the other request if it is actually a
                // candidate for it, otherwise that request comes away empty.
                var mine = holder[i3];
                var mineFitsOther = mine !== null && score[other][mine] !== undefined;
                before = val(i3, mine) + val(other, vid);
                after = val(i3, vid) + (mineFitsOther ? val(other, mine) : 0);
                if (after > before) {
                    holder[i3] = vid; owner[vid] = i3;
                    if (mineFitsOther) { holder[other] = mine; owner[mine] = other; }
                    else { holder[other] = null; if (mine !== null) delete owner[mine]; }
                    moved = true;
                }
            }
        }
    }
}
Designing it in
The change is in the dispatch worker. A MATCH environment variable picks the policy, so one binary runs both arms and nothing else about a run differs. In batch mode the worker keeps receiving until a time window runs out or the batch is full.
if (MATCH === 'batch') {
  var deadline = Date.now() + WINDOW_MS;
  while (running && Date.now() < deadline && msgs.length < MAX_BATCH) {
    var more = await get(QUEUE + '/queue/rides/receive?max=' + BATCH);
    if (more.messages && more.messages.length) msgs = msgs.concat(more.messages);
    else await sleep(5);
  }
  await handleBatch(msgs);
} else {
  await Promise.all(msgs.map(m => handle(m)));
}
handleBatch asks the state service for candidates for every request in the batch, solves the assignment, then claims. A claim can still lose a race to another worker. When that happens the request falls back down its own candidate list rather than being dropped.
The load harness already had the number I needed and was throwing it away. The worker publishes the pickup distance in metres on every match. The harness subscribed to that topic and ignored the field, so recording it was a small change.
Offline: where batching pays and where it does not
Before touching the running system I measured the decision on its own. An offline bench builds batches of requests against a 2,000-car fleet with a set share of cars already busy, and runs both policies on identical inputs. Queueing, claim races and the batch window are out of the picture. The knob that matters is how many free cars there are per request in the batch.
| Batch | Free cars | Cars per request | Greedy (m) | Batched (m) | Change | Batches won |
|---|---|---|---|---|---|---|
| 8 | 800 | 100.0 | 322 | 321 | −0.1% | 5 of 300 |
| 8 | 10 | 1.3 | 4,607 | 4,224 | −8.3% | 235 of 300 |
| 32 | 800 | 25.0 | 325 | 323 | −0.7% | 86 of 300 |
| 32 | 10 | 0.3 | 5,505 | 1,838 | −66.6% | 300 of 300 |
| 128 | 800 | 6.3 | 338 | 332 | −1.7% | 291 of 300 |
| 128 | 10 | 0.1 | 5,427 | 833 | −84.7% | 300 of 300 |
Each row is 300 batches. A batch counts as won when, on the same input, the hill climb matched more riders than greedy, or the same number with less total distance.
In a thick market the two policies are the same thing. With 800 free cars and eight requests, the nearest car to one request is almost never the nearest car to another. There is nothing to trade, and 295 of 300 batches came out identical. As the market thins, greedy's ordering starts to matter. At 128 requests against 10 free cars, both policies serve 10 riders per batch. Greedy serves the first 10 to ask and the search serves the 10 nearest the free cars, so the 85% shorter mean comes partly from serving different riders.
This fits Eom and Toriello's picture, where a bigger pool lets batching get close to optimal while plain greedy stays well short. Their pool grows with waiting time and mine with requests per free car, so I am drawing an analogy and have not replicated their result.
End to end, on the running platform
The offline result says the mechanism works. The project needed to know whether it survives queueing, claim races and a fleet whose cars come and go. I used the same five-stage ramp as the project report: 2,000 vehicles, one dispatch worker, a matched car held for 300 ms, everything else held still. The greedy arm ran twice and its figures are the mean of the two. The batched arm holds requests for up to 250 ms or until it has 64, whichever comes first.
view data
| offered | Greedy | Batched |
|---|---|---|
| 200/s | 238 m | 237 m |
| 800/s | 1,189 m | 861 m |
| 1,600/s | 968 m | 777 m |
| 3,000/s | 1,044 m | 796 m |
| 800/s | 1,074 m | 820 m |
| Offered/s | Greedy mean m | Greedy p95 m | Greedy p95 ms | Batched mean m | Change | Batched p95 m | Batched p95 ms |
|---|---|---|---|---|---|---|---|
| 200 | 238 | 500 | 29 | 237 | −0.4% | 497 | 283 |
| 800 | 1,189 | 6,412 | 34 | 861 | −27.6% | 3,528 | 112 |
| 1,600 | 968 | 4,260 | 40 | 777 | −19.7% | 3,029 | 111 |
| 3,000 | 1,044 | 4,868 | 94 | 796 | −23.8% | 3,065 | 111 |
| 800 | 1,074 | 5,154 | 36 | 820 | −23.6% | 3,326 | 113 |
Across the four loaded stages, greedy averaged 1,068 m of pickup distance and the batched arm averaged 814 m. At the 95th percentile the gap was wider, 5,174 m against 3,237 m. The rider who was going to wait longest gained most, which is the half of the distribution I care about. Match latency went the other way. At the 95th percentile it rose from 51 ms to 112 ms.
The first stage is the control, and it is the most useful row in the table. At 200 requests a second the fleet is thick. Pickup distance is the same to within a metre, so they are probably picking the same cars, and the batched arm pays the whole latency cost for nothing. That is the offline finding showing up unchanged in the live system.
The fallback has a cost too. When the solver's car has gone, or the solver left the request without one, the worker walks that request's own candidate list. In the 250 ms run it fell back 683 times in 79,942 matches, a little under 1%. The fallback also does not know what the solver promised the other requests in the same batch, so it can take a car a batchmate was about to claim. At under 1% it probably does not move the means much. It does mean the assignment that runs is not always exactly the one the hill climb computed.
The knob that actually moves it
I ran the batch window at 250, 500 and 1,000 ms and it barely mattered: 814, 818 and 858 m across the loaded stages. The window is not what ends a batch at these rates. At 800 requests a second, 64 requests arrive in about 80 ms, so the size limit is hit long before the window runs out. I did not time batches, so that is arithmetic and not a measurement.
Batch size is the real knob. For this sweep I held the window at 2,000 ms so it never binds, and labelled each row by the batch size the worker actually reached. The receive call takes up to eight messages before the size limit is checked, so eight is the floor and asking for four gets eight. That is a bug in my loop. It gave me a free replicate, since the runs at 4 and 8 are the same condition. They came out at 1,062 and 1,051 m, eleven metres apart. Their p95 latencies were 42 and 152 ms, so the 97 ms in the table is an average of two quite different runs.
view data
| batch | Mean pickup distance |
|---|---|
| greedy | 1,068 m |
| 8 | 1,056 m |
| 16 | 1,018 m |
| 32 | 998 m |
| 65 | 828 m |
| 129 | 667 m |
| Mean batch | Runs | Mean m | vs greedy | p95 m | p95 ms |
|---|---|---|---|---|---|
| greedy, up to 8 at once | 2 | 1,068 | – | 5,174 | 51 |
| 8 | 2 | 1,056 | −1.1% | 5,048 | 97 |
| 16 | 1 | 1,018 | −4.8% | 4,595 | 86 |
| 32 | 1 | 998 | −6.6% | 4,564 | 110 |
| 65 | 1 | 828 | −22.5% | 3,336 | 115 |
| 129 | 1 | 667 | −37.6% | 2,416 | 167 |
Mean pickup distance falls at every step as the batch grows, and the total matched barely moves: 80,183 for greedy against 79,847 at a batch of 128, a 0.4% difference. So batching is not buying shorter trips by refusing riders. It sends the same number of cars to better places. The latency column is noisier, because a batch that fills early and one that waits out its window behave differently. I would want more than one run per row before reading much into any single latency figure.
The failure I found by sweeping that knob
The first time I ran that sweep it broke. This is the harness output at a batch of 128, with four latency columns cut out to fit the page.

At a batch of 128 the worker matched almost nothing from stage two, and nothing at all from stage three. At 64 it fell over during the last stage. The likely cause was in my own code. handleBatch asked the state service for candidates one request at a time, in a loop, awaiting each one. So the wall-clock cost of a batch grew with its size. The queue hides a received message for 20 seconds, and a batch that takes longer than that has lost its claim on the work before it finishes.
I have to be careful how far I push that. I never timed a batch, the 20 seconds is the queue's setting rather than a measurement, and how the run failed to recover is inference. The log also shows every request answered with no vehicle, which I cannot fully explain. The serial version is not in git either, so the before code rests on the paper alone. What is measured is that the serial version stopped matching under load at 128 and the parallel version does not. The fix was to send the lookups together and settle the claims together.
var cands = await Promise.all(reqs.map(r =>
  get(STATE + '/candidates?lat=' + r.lat + '&lng=' + r.lng +
      '&minBattery=' + MIN_BATTERY + '&limit=10')
    .then(c => c.candidates || [])
    .catch(() => [])));

var picked = assign.hillClimb(reqs, cands);

await Promise.all(msgs.map((m, j) => settle(m, picked[j], cands[j])));
Every number above is from after that change. The algorithm was fine at every batch size I tried. What failed was a serial loop inside a service whose input size I had just made variable. It failed the way the unit warns about: work pushed past a timeout somewhere else in the system, so a slowdown turns into a retry storm. I learned more from it than from the headline result.
What it says, and what it does not
Batching is worth having on this system, for a reason I only found by measuring. My fleet is thick at low load and thin at high load, and the thin case is where riders wait longest. A policy that only helps in the thin case helps exactly where it matters. The price is a p95 match latency that roughly doubles. For a taxi that is a fair trade for about 250 m less driving per pickup. For a service that has to answer fast it would not be.
Five things I would not claim from this:
- That I built DiDi's system. My score is a distance. Their first stage is a learned model of whether a human driver takes the job, and I deleted it because my cars cannot refuse. I implemented their optimiser, and their 84.4% success rate is not a number my result can be compared with.
- That it wins every batch. The hill climb maximises a distance score, not mean distance, and a swap can leave one request without a car. At 32 requests against 40 free cars it was 10.8% better overall and still worse than greedy on 43 of 300 batches, 41 of them because it matched one rider fewer. Most batched live rows are a single run, so a gap of a percent or two between two batched rows is inside the noise.
- That it adds capacity. The project report concluded that at 3,000 requests a second the limit is the number of cars, though my instrumentation could not cleanly separate the two possible causes. Batching sends the cars I have to better places. It does not make more of them.
- Anything about a real network. Every run in this post was on one laptop with no network between tiers. Greedy sends its lookups in groups of up to eight and the batched arm in groups of up to 64, so a real hop to the state service would be spread over more requests by the batched arm. I expect the trade looks better with a network in the path, but I have not measured it.
- Anything about clustered demand. Requests and cars are spread evenly over the box. Real demand clusters, and I did not test that.
References
- Zhang, L. et al. (2017). A Taxi Order Dispatch Model based On Combinatorial Optimization. KDD '17, Halifax, Canada.
- Eom, M. and Toriello, A. (2026). Batching and Greedy Policies: How Good Are They in Dynamic Matching? Manufacturing & Service Operations Management 28(2). I read the author manuscript dated 26 August 2025, so the quoted figures are the manuscript's.
Read the full paper (PDF). It is the paper as submitted, so a few points this post corrects are still in it.