Fleet platform
uni project · SIT314 · T2 2026The backend for a fleet of driverless taxis. 2,000 simulated taxis report where they are every two seconds, and a rider who asks for a car gets the nearest free one. I load-tested it on my laptop, then moved the matching path to AWS and watched it scale itself up and back down.

The final project for SIT314, Software Architecture and Scalability for the Internet of Things, at Deakin in Trimester 2 2026. The brief was a cloud backend for a driverless-taxi fleet that keeps working as the load grows.
Nothing here is live. I built the AWS part on my own account, measured it and tore it down on 26 Aug 2026, and the repo is private. Every number on this page comes from a run log.
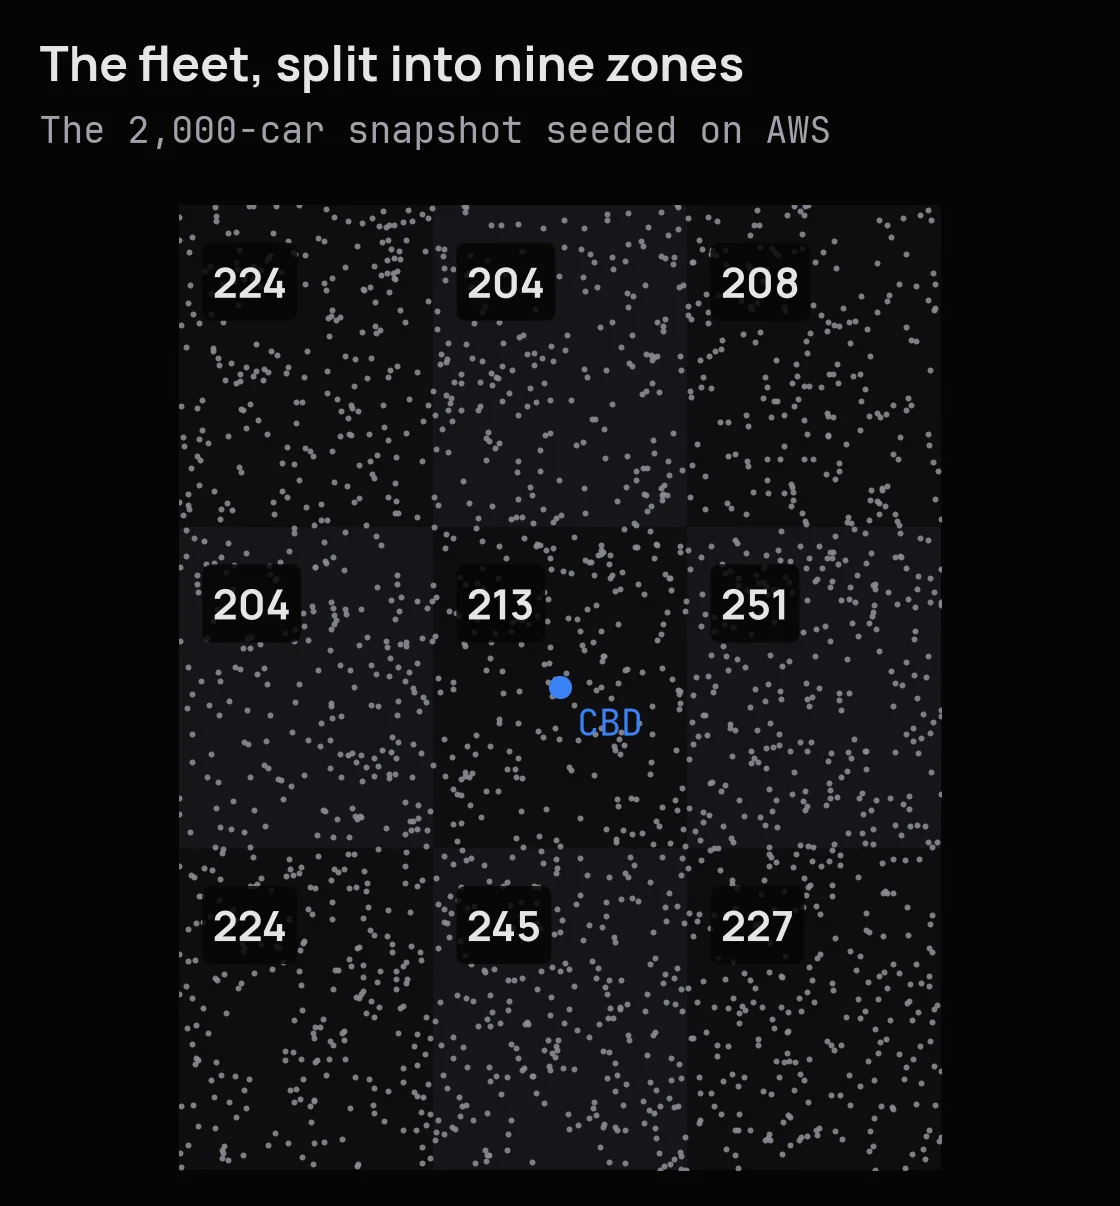
Each taxi publishes its position, battery and status over MQTT. A Node-RED flow drops readings outside the service area, readings with a repeated timestamp and readings where nothing moved. It then tags each one with one of nine zones. The simulator corrupts 6% of its output on purpose, so the filter has real work to do.
22 Aug 21:01:47 - [info] [debug:ingest stats]
{
  in: 58000,
  out: 54650,
  dropped: 3350,
  badRange: 1250,
  dupTs: 1028,
  unchanged: 1072,
  dropPct: 5.8,
[...]
--- state service, the subscriber side ---
{"vehicles":2000,"idle":2000,"zones":{"z1-0":255,"z2-1":246,"z0-2":223,"z0-0":218,"z2-0":225,"z2-2":204,"z0-1":202,"z1-2":214,"z1-1":213},"counters":{"events":758685,"claims":281214,"claimConflicts":19602,"noCandidate":0}}
--- state service before the run, for the delta ---
{"vehicles":2000,"idle":932,"zones":{"z1-0":248,"z2-1":255,"z0-2":222,"z0-0":218,"z2-0":225,"z2-2":199,"z0-1":207,"z1-2":214,"z1-1":212},"counters":{"events":704035,"claims":281214,"claimConflicts":19602,"noCandidate":0}}
58,000 readings went in and 54,650 came out. The state service counted 758,685 minus 704,035 events, which is the same 54,650. The code was fine; the first attempts disagreed because of how I measured. Node-RED only reports every ten seconds, so the run now restarts it first and waits 25 seconds after the last reading before it reads either side.
A load harness sends ride requests in five stages, from 200 a second up to 3,000 and back down to 800. Each request goes on a queue. A dispatch worker takes eight at a time, asks the state service for idle cars nearby and claims one. A claim can lose to another worker, and then it tries the next car on its list. Across the two runs below that happened on about one claim in twelve: 27,429 lost claims out of 321,340.
I ran the ramp twice, once with a single worker and once with an autoscaler free to run up to six.
view data
| stage | offered | one worker | autoscaled, 1 to 6 |
|---|---|---|---|
| 200/s | 198.1/s | 198.1/s | 196.9/s |
| 800/s | 792.7/s | 725.4/s | 720.3/s |
| 1,600/s | 1,584.2/s | 917.4/s | 928.2/s |
| 3,000/s | 2,969.9/s | 957.5/s | 922.9/s |
| 800/s | 787.7/s | 690.4/s | 708.9/s |
stage  asked   actual  sent   matched  unmatched  p50    p95    p99    max    matched/s  mean m  p95 m
1      200/s   198.1   4000   4000     0          19     32     35     40     198.1      238     497
2      800/s   792.7   16000  14643    1357       25     43     48     53     725.4      1205    6519
3      1600/s  1584.2  32000  18531    13469      27     46     52     58     917.4      939     4091
4      3000/s  2969.9  90000  29017    60983      27     45     50     55     957.5      1048    5046
5      800/s   787.7   16000  14024    1976       24     40     48     65     690.4      1032    4797

sent 158000  matched 80215  unmatched 77785  never answered 0  arrived after their stage 560
Both runs flatten near 950 matches a second, and both leave about 61,000 requests without a car at the 3,000 stage. p95 latency held at 45 ms there and no request went unanswered, so the worker kept up with everything it was given. Each match holds a car for 300 ms, and the simulator then keeps it on a trip for half a second to a second. I read the limit as free cars running out, though my counters could not tell an empty candidate list apart from a car another worker claimed first. Either way it was not the matching service, which is the part I spent the project scaling. The autoscaler never went past three workers.
I ran the same script again on 27 Oct 2026, from a copy of the repo, without Postgres, on a laptop busy with other work. Ingest came out identical, because the simulator is seeded. Matching peaked at 968.6 a second with one worker and 971.2 autoscaled. Same ceiling.
Each match also sends a trip to a trip service, which writes to Postgres 16 in batches: once a second, at most 500 rows. The matcher was producing about 960 a second. On 24 Aug I ran the ramp once more and watched the writer instead.
--- trip service counters, one line every 5 s ---
trips written=0  dropped=0  buffered=0
[...]
trips written=45980  dropped=0  buffered=29695
trips written=48480  dropped=0  buffered=30783
trips written=50980  dropped=0  buffered=29003
trips written=53480  dropped=0  buffered=26503
[...]
trips written=78480  dropped=0  buffered=1503
trips written=79983  dropped=0  buffered=0

--- rows actually in postgres ---
79983
The buffer peaked at 30,783 rows and took about a minute to clear after the load stopped. The worker matched 79,983 rides, the trip service wrote 79,983 rows, and the table held 79,983. The rows arrived late, but they all arrived. The cap is not Postgres: the 500 is a constant in my own flush loop.
I moved the part the project is about. The ride queue became SQS, and the dispatch worker and state service became Fargate tasks on ARM64 at a quarter of a vCPU. The state service was seeded from a snapshot of the fleet. Ingest, the broker, the monitor and Postgres stayed on my laptop.

Two CloudWatch alarms watch the number of rides waiting. Above 200 for a minute, a step policy adds dispatch tasks, more of them the further over it is. Below 50 for two minutes, another removes two. The count stays between one and six.

The run asked for 25 requests a second for 90 s, then 200 for 240 s, then 25 for 240 s. That is far below the 3,000 a second on the laptop, on purpose. It is there to show the policy working, not to measure speed, so I never put its numbers beside the local ones.
view data
| since the poller started | waiting |
|---|---|
| 0:00 | 3 rides |
| 0:11 | 4 rides |
| 0:22 | 0 rides |
| 0:32 | 3 rides |
| 0:43 | 4 rides |
| 0:54 | 2 rides |
| 1:05 | 3 rides |
| 1:15 | 3 rides |
| 1:26 | 3 rides |
| 1:37 | 0 rides |
| 1:47 | 647 rides |
| 1:58 | 1,717 rides |
| 2:09 | 0 rides |
| 2:20 | 1,297 rides |
| 2:30 | 5,997 rides |
| 2:41 | 1,677 rides |
| 2:52 | 8,017 rides |
| 3:03 | 8,017 rides |
| 3:13 | 8,057 rides |
| 3:24 | 7,007 rides |
| 3:35 | 12,097 rides |
| 3:45 | 10,027 rides |
| 3:56 | 13,107 rides |
| 4:07 | 11,054 rides |
| 4:17 | 13,537 rides |
| 4:28 | 17,136 rides |
| 4:39 | 17,767 rides |
| 4:50 | 16,087 rides |
| 5:00 | 19,057 rides |
| 5:11 | 17,767 rides |
| 5:22 | 19,187 rides |
| 5:33 | 18,177 rides |
| 5:43 | 12,064 rides |
| 5:54 | 8,669 rides |
| 6:05 | 8,669 rides |
| 6:16 | 12,064 rides |
| 6:26 | 15,407 rides |
| 6:37 | 0 rides |
| 6:48 | 8 rides |
| 6:59 | 0 rides |
| 7:09 | 0 rides |
| 7:20 | 0 rides |
| 7:31 | 0 rides |
| 7:42 | 0 rides |
| 7:52 | 0 rides |
| 8:03 | 0 rides |
| 8:14 | 0 rides |
| 8:25 | 0 rides |
| 8:35 | 0 rides |
| 8:46 | 0 rides |
| 8:57 | 0 rides |
| 9:08 | 0 rides |
| 9:18 | 0 rides |
| 9:29 | 0 rides |
| 9:40 | 0 rides |
| 9:51 | 0 rides |
| 10:01 | 0 rides |
| 10:12 | 0 rides |
| 10:23 | 0 rides |
| 10:34 | 0 rides |
| 10:44 | 0 rides |
| 10:55 | 0 rides |
| 11:06 | 0 rides |
| 11:17 | 0 rides |
| 11:27 | 0 rides |
| 11:38 | 0 rides |
| 11:49 | 0 rides |
| 12:00 | 0 rides |
| 12:11 | 0 rides |
| 12:21 | 0 rides |
| 12:32 | 0 rides |
| 12:43 | 0 rides |
| 12:54 | 0 rides |
| 13:04 | 0 rides |
| 13:15 | 0 rides |
| 13:26 | 0 rides |
| 13:36 | 0 rides |
| 13:47 | 0 rides |
| 13:58 | 0 rides |
| 14:09 | 0 rides |
| 14:19 | 0 rides |
| 14:30 | 0 rides |
| 14:41 | 0 rides |
| 14:52 | 0 rides |
| 15:02 | 0 rides |
| 15:13 | 0 rides |
| 15:24 | 0 rides |
| 15:35 | 0 rides |
| 15:46 | 0 rides |
| 15:56 | 0 rides |
| 16:07 | 0 rides |
| 16:18 | 0 rides |
| 16:29 | 0 rides |
| 16:39 | 0 rides |
| 16:50 | 0 rides |
| 17:01 | 0 rides |
| 17:12 | 0 rides |
| 17:22 | 0 rides |
| 17:33 | 0 rides |
| 17:44 | 0 rides |
| 17:54 | 0 rides |
| 18:05 | 0 rides |
| 18:16 | 0 rides |
| 18:27 | 0 rides |
| 18:37 | 0 rides |
| 18:48 | 0 rides |
| 18:59 | 0 rides |
| 19:10 | 0 rides |
| 19:21 | 0 rides |
| 19:31 | 0 rides |
| 19:42 | 0 rides |
| 19:53 | 0 rides |
| 20:03 | 0 rides |
| 20:14 | 0 rides |
| 20:25 | 0 rides |
| 20:36 | 0 rides |
| 20:46 | 0 rides |
| 20:57 | 0 rides |
| 21:08 | 0 rides |
| 21:19 | 0 rides |
| 21:29 | 0 rides |
view data
| since the poller started | desired | running |
|---|---|---|
| 0:00 | 1 tasks | 1 tasks |
| 0:11 | 1 tasks | 1 tasks |
| 0:22 | 1 tasks | 1 tasks |
| 0:32 | 1 tasks | 1 tasks |
| 0:43 | 1 tasks | 1 tasks |
| 0:54 | 1 tasks | 1 tasks |
| 1:05 | 1 tasks | 1 tasks |
| 1:15 | 1 tasks | 1 tasks |
| 1:26 | 1 tasks | 1 tasks |
| 1:37 | 1 tasks | 1 tasks |
| 1:47 | 1 tasks | 1 tasks |
| 1:58 | 1 tasks | 1 tasks |
| 2:09 | 1 tasks | 1 tasks |
| 2:20 | 1 tasks | 1 tasks |
| 2:30 | 1 tasks | 1 tasks |
| 2:41 | 1 tasks | 1 tasks |
| 2:52 | 1 tasks | 1 tasks |
| 3:03 | 1 tasks | 1 tasks |
| 3:13 | 1 tasks | 1 tasks |
| 3:24 | 1 tasks | 1 tasks |
| 3:35 | 1 tasks | 1 tasks |
| 3:45 | 1 tasks | 1 tasks |
| 3:56 | 1 tasks | 1 tasks |
| 4:07 | 1 tasks | 1 tasks |
| 4:17 | 1 tasks | 1 tasks |
| 4:28 | 4 tasks | 1 tasks |
| 4:39 | 4 tasks | 1 tasks |
| 4:50 | 4 tasks | 1 tasks |
| 5:00 | 4 tasks | 4 tasks |
| 5:11 | 4 tasks | 4 tasks |
| 5:22 | 4 tasks | 4 tasks |
| 5:33 | 4 tasks | 4 tasks |
| 5:43 | 4 tasks | 4 tasks |
| 5:54 | 4 tasks | 4 tasks |
| 6:05 | 4 tasks | 4 tasks |
| 6:16 | 4 tasks | 4 tasks |
| 6:26 | 6 tasks | 4 tasks |
| 6:37 | 6 tasks | 4 tasks |
| 6:48 | 6 tasks | 4 tasks |
| 6:59 | 6 tasks | 6 tasks |
| 7:09 | 6 tasks | 6 tasks |
| 7:20 | 6 tasks | 6 tasks |
| 7:31 | 6 tasks | 6 tasks |
| 7:42 | 6 tasks | 6 tasks |
| 7:52 | 6 tasks | 6 tasks |
| 8:03 | 6 tasks | 6 tasks |
| 8:14 | 6 tasks | 6 tasks |
| 8:25 | 6 tasks | 6 tasks |
| 8:35 | 6 tasks | 6 tasks |
| 8:46 | 6 tasks | 6 tasks |
| 8:57 | 6 tasks | 6 tasks |
| 9:08 | 6 tasks | 6 tasks |
| 9:18 | 6 tasks | 6 tasks |
| 9:29 | 6 tasks | 6 tasks |
| 9:40 | 6 tasks | 6 tasks |
| 9:51 | 6 tasks | 6 tasks |
| 10:01 | 6 tasks | 6 tasks |
| 10:12 | 6 tasks | 6 tasks |
| 10:23 | 6 tasks | 6 tasks |
| 10:34 | 6 tasks | 6 tasks |
| 10:44 | 6 tasks | 6 tasks |
| 10:55 | 6 tasks | 6 tasks |
| 11:06 | 6 tasks | 6 tasks |
| 11:17 | 6 tasks | 6 tasks |
| 11:27 | 4 tasks | 4 tasks |
| 11:38 | 4 tasks | 4 tasks |
| 11:49 | 4 tasks | 4 tasks |
| 12:00 | 4 tasks | 4 tasks |
| 12:11 | 4 tasks | 4 tasks |
| 12:21 | 4 tasks | 4 tasks |
| 12:32 | 4 tasks | 4 tasks |
| 12:43 | 4 tasks | 4 tasks |
| 12:54 | 4 tasks | 4 tasks |
| 13:04 | 4 tasks | 4 tasks |
| 13:15 | 4 tasks | 4 tasks |
| 13:26 | 4 tasks | 4 tasks |
| 13:36 | 4 tasks | 4 tasks |
| 13:47 | 4 tasks | 4 tasks |
| 13:58 | 4 tasks | 4 tasks |
| 14:09 | 4 tasks | 4 tasks |
| 14:19 | 4 tasks | 4 tasks |
| 14:30 | 2 tasks | 2 tasks |
| 14:41 | 2 tasks | 2 tasks |
| 14:52 | 2 tasks | 2 tasks |
| 15:02 | 2 tasks | 2 tasks |
| 15:13 | 2 tasks | 2 tasks |
| 15:24 | 2 tasks | 2 tasks |
| 15:35 | 2 tasks | 2 tasks |
| 15:46 | 2 tasks | 2 tasks |
| 15:56 | 2 tasks | 2 tasks |
| 16:07 | 2 tasks | 2 tasks |
| 16:18 | 2 tasks | 2 tasks |
| 16:29 | 2 tasks | 2 tasks |
| 16:39 | 2 tasks | 2 tasks |
| 16:50 | 2 tasks | 2 tasks |
| 17:01 | 2 tasks | 2 tasks |
| 17:12 | 2 tasks | 2 tasks |
| 17:22 | 2 tasks | 2 tasks |
| 17:33 | 1 tasks | 1 tasks |
| 17:44 | 1 tasks | 1 tasks |
| 17:54 | 1 tasks | 1 tasks |
| 18:05 | 1 tasks | 1 tasks |
| 18:16 | 1 tasks | 1 tasks |
| 18:27 | 1 tasks | 1 tasks |
| 18:37 | 1 tasks | 1 tasks |
| 18:48 | 1 tasks | 1 tasks |
| 18:59 | 1 tasks | 1 tasks |
| 19:10 | 1 tasks | 1 tasks |
| 19:21 | 1 tasks | 1 tasks |
| 19:31 | 1 tasks | 1 tasks |
| 19:42 | 1 tasks | 1 tasks |
| 19:53 | 1 tasks | 1 tasks |
| 20:03 | 1 tasks | 1 tasks |
| 20:14 | 1 tasks | 1 tasks |
| 20:25 | 1 tasks | 1 tasks |
| 20:36 | 1 tasks | 1 tasks |
| 20:46 | 1 tasks | 1 tasks |
| 20:57 | 1 tasks | 1 tasks |
| 21:08 | 1 tasks | 1 tasks |
| 21:19 | 1 tasks | 1 tasks |
| 21:29 | 1 tasks | 1 tasks |
[...]
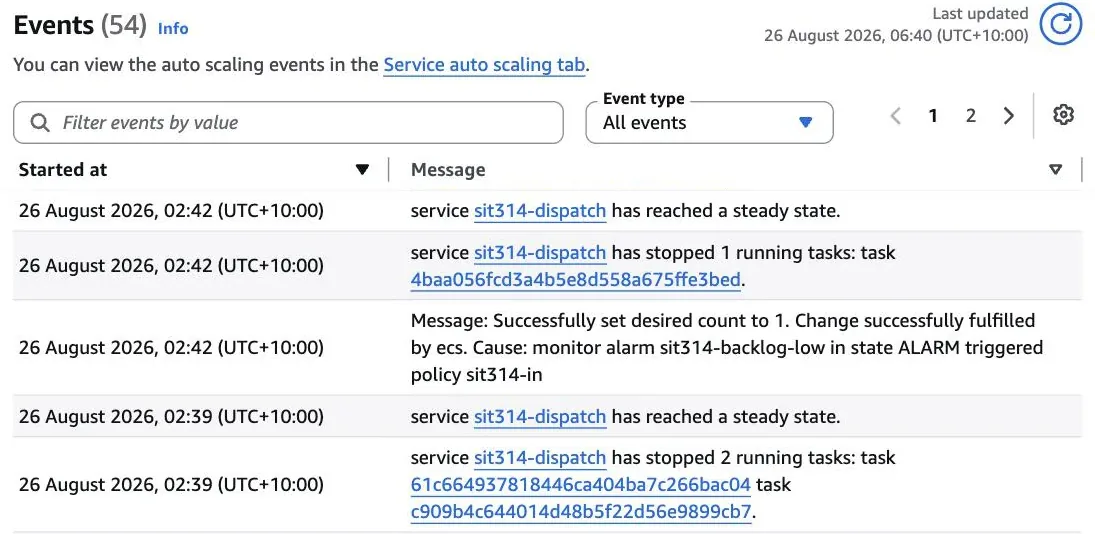
    {
        "start": "2026-08-26T02:31:42.015000+10:00",
        "cause": "monitor alarm sit314-backlog-high in state ALARM triggered policy sit314-out",
        "status": "Successfully set desired count to 6. Change successfully fulfilled by ecs."
    },
    {
        "start": "2026-08-26T02:29:42.043000+10:00",
        "cause": "monitor alarm sit314-backlog-high in state ALARM triggered policy sit314-out",
        "status": "Successfully set desired count to 4. Change successfully fulfilled by ecs."
    },
[...]
stage  asked   actual  sent   matched  unmatched  mean m  p95 m
1      25/s    29.6    2700   2700     0          262     563
2      200/s   198     48000  28027    19973      3764    11118
3      25/s    29.6    7200   6171     1029       535     1655

sent 57900  matched 36898  unmatched 21002  never answered 0  arrived after their stage 15360
The task count went 1, 4, 6, then back to 4, 2 and 1, and AWS records the alarm and policy behind every step. 36,898 of 57,900 requests were matched. Almost all of the 21,002 misses are in the 200-a-second stage, and fleet size explains them on its own: a match holds a car for 20 s here, so 198 a second needs about 3,960 cars, and there were 2,000. That points the same way as the laptop runs. My poller saw a peak of 19,187 waiting, while CloudWatch's highest one-minute average was 15,071. The alarm reads the average, which is part of why scaling out lags.
Each of three demo vehicles has its own X.509 certificate, under one IoT policy scoped by thing name. To test it, I pointed v0000's certificate at v0001's topic. IoT Core does not send back an error, it just drops the connection, so the proof is in AWS's own log. The state service has no task role, accepts traffic only from the dispatch security group, and wants a bearer token that reaches the container as a Secrets Manager ARN.
$ aws logs filter-log-events --log-group-name AWSIotLogsV2 --start-time <this run>
  Publish-In   AUTHORIZATION_FAILURE  clientId=v0000    fleet/vehicle/v0001/telemetry  x4

2026-08-25T20:56:22 SEC_PROBE GET /stats with no bearer header -> HTTP 401 {"ok":false,"error":"unauthorized"}
2026-08-25T20:56:22 SEC_PROBE GET /stats with the bearer header -> HTTP 200 {"vehicles":2000, [...]
Three certificates and not 2,000 is a real gap. The simulator drives the whole fleet over one connection at about 1,000 messages a second, and IoT Core allows roughly 100 per connection, so a real fleet needs a connection and a certificate per car. Mosquitto, which stayed local, has no TLS and no device identity at all.
The worker takes eight requests at once, then lets each one race for its own nearest car. As an extension I tried a batched hill climb adapted from a 2017 DiDi paper. It collects requests for 250 ms and assigns cars to the whole batch together.
view data
| stage | nearest car first | batched, 250 ms |
|---|---|---|
| 200/s | 238 m | 237 m |
| 800/s | 1,189 m | 861 m |
| 1,600/s | 968 m | 777 m |
| 3,000/s | 1,044 m | 796 m |
| 800/s | 1,074 m | 820 m |
view data
| stage | nearest car first | batched, 250 ms |
|---|---|---|
| 200/s | 29 ms | 283 ms |
| 800/s | 34 ms | 112 ms |
| 1,600/s | 40 ms | 111 ms |
| 3,000/s | 94 ms | 111 ms |
| 800/s | 36 ms | 113 ms |
Across the loaded stages, mean pickup distance fell from 1,068 m to 814 m, about a quarter. The cost was latency: p95 went from 51 ms to 112 ms. The full comparison is in the post Batched assignment in a driverless-taxi fleet.
Move to AWS early. I left it until the end, so the experiments ran on two shapes of infrastructure instead of one. I also scaled the wrong thing: the matcher never became the bottleneck, and the fleet most likely did.
Two limits are my own doing. The trip writer's 500 rows a second is a constant I hard-coded. And the scaling policy reads raw queue depth. Once enough tasks keep up, the depth sits near zero however busy the system is, so the low alarm could remove tasks that are still needed. On this run the scale-in came after the load had dropped, so I never saw it, but I would scale on the arrival rate instead.